Overlapping I/O With Inference Around One Shared Model, Not Batching, Raised Mac Mini Throughput on I/O-Bound Restores
Diffio 4.5 restores speech on a fleet of Mac minis (M4 Pro, 24 GB of unified memory). Each mini runs one worker, which can serve our production environment, our dev environment or both. The worker takes jobs from each enabled environment's edge scheduler (a Cloudflare Durable Object that queues jobs and hands them to connected workers), downloads the upload and its transcript, restores it, and publishes the result as HLS (HTTP Live Streaming) audio that plays while later parts are still restoring, then as final files. The worker used to run one job at a time, so under load users waited for whole jobs ahead of them. It now runs several jobs at once around a single copy of the model, and a burst of six uploads drains 3.3x faster.
| Six 45 s jobs submitted at once, one mini, stems uploaded one at a time | Makespan | Median time to first audio | Worst time to first audio |
|---|---|---|---|
| One job at a time | 140 s | 63 s | 120 s |
| Three jobs at once, one model | 59 s | 16 s | 41 s |
| Six jobs at once, one model | 42 s | 6.1 s | 9.8 s |
The makespan runs from submitting the burst to the last job's completion; time to first audio runs from submitting a job until its first HLS segment is playable.
Inference occupied 7–26% of a dev restore job's wall-clock time
Across logged dev restore jobs, inference took 15% of wall-clock time; the rest was downloading, decoding, MP3 and HLS encoding, and uploading through the edge. The fraction depends on the sampler: pro, which uses best-of-three sampling and selects the speech and the background separately, spends longer in the model than flash, the default.
| Audio, sampler (12 dev jobs) | Wall-clock job time | Inference time | Inference fraction |
|---|---|---|---|
| 11–45 s, flash | 7.5–23 s | 0.8–1.7 s | 7–11% |
| 11–30 s, pro | 9.9–21 s | 2.6–4.4 s | 21–26% |
| 3 min, pro | 102 s | 18 s | 18% |
With inference as the serial part, overlapping jobs can raise throughput by at most the inverse of the inference fraction (Amdahl's law), 9–14x for flash and 4–5x for pro, and by at most the number of jobs allowed at once; both bounds assume the I/O and encoding of different jobs overlap without contending. Once stems moved after job completion (described later), inference became about 70% of a production pro job, which caps the overlap gain for those jobs near 1.4x; the burst speedup applies to I/O-bound jobs.
A single inference thread serves several concurrent job slots
The worker now runs up to six jobs at once. Each job does its downloads, decoding, encoding and uploads on its own thread; restore jobs queue for a single inference thread, the one thread that loads and runs the model, so MLX and PyTorch MPS state stays on one thread as it did when one job thread did everything. The inference queue serves production restores before dev ones, and within each environment shortest job first by expected inference time: audio seconds divided by the sampler's measured speed, 11x real time for pro and 35x for flash. Shortest job first can starve a long file, so the queue applies aging: a restore that has waited a bounded time or been passed over a bounded number of times goes next within its environment. A job waiting for inference stays in the "preparing audio" phase it was already reporting, and a cancel while it waits removes it before it starts.
The scheduler had assumed one job per worker, and its protocol changed with the worker. A worker tells each environment's scheduler how many more jobs it can take and which jobs it still runs there (a ready message with slots and jobIds). The scheduler assigns up to that many, re-queues any accepted job the worker no longer lists, and treats a rejection as zero open slots until the next ready. A freed slot is offered to production at once and to dev half a second later; if both environments assign the last slot at the same moment, the worker rejects one and the scheduler re-queues it without counting it against the job's retry limit.
Overlapping jobs makes each one slower, 21–28 s when it runs by itself and 33–40 s among six, because their uploads share the mini's uplink. The burst's makespan is set by the slowest job's I/O, not by inference: inference-thread utilization was 22% over the burst, and a restore took as long with other jobs running as without.
| Six 3 min jobs at once, six slots | Makespan | Median time to first audio | Worst time to first audio | Worker resident memory |
|---|---|---|---|---|
| Flash | 194 s | 17 s | 31 s | 5.3 GB idle, 7.4 GB peak (about 350 MB per running job), no swap |
Inference is scheduled non-preemptively, one whole restore at a time, so a long file causes head-of-line blocking: a 20-minute file holds the inference thread for about 33 s with flash and 107 s with pro. Restores already advance window by window, so scheduling at window granularity is the next step; it needs a separate codec decoder KV cache per job, since the decoder keeps its keys and values across windows. Six 20-minute files at once are unmeasured.
Stem uploads were bound by per-request cost, not bandwidth or CPU, and now follow the job's completion
A restore publishes its separated speech and background as stems; when we measured, that was about 100 WAV and FLAC objects (250 MB) for a 3 min file, each a PUT through the edge. Uploaded serially, they took most of the job, while the worker and ffmpeg used 15 s of CPU. Each PUT costs 0.3–0.5 s of fixed overhead plus its transfer at 5–10 MB/s per stream. The overhead is in the edge, not the 3–22 ms network round trip: the edge checks the job's scheduler lease and writes to R2, Cloudflare's object store where the media lives, on every PUT. Every worker upload pays it, so caching the lease check per job is the next speedup for all of them.
The worker now uploads eight objects at a time while later chunks are still encoding, which overlaps both the overhead and the per-stream transfer. At most 32 wait in the queue, so disk use stays bounded, and the manifest goes last, once every object it lists exists.
| 3 min file, flash, one mini | Stem upload phase, median | Job, median |
|---|---|---|
| One at a time | 88 s | 95 s |
| 8 at a time | 32 s | 39 s |
| 16 at a time | 37 s | 43 s |
Eight at a time per job multiplied across six jobs, all contending for one home uplink. Each job still sends at most eight, and a worker-wide AIMD (additive increase, multiplicative decrease) concurrency limit, as in TCP congestion control, now bounds them together: it adds about one request per window without failures and halves on a timeout or failure, within 2–16, and like TCP it treats every failure as congestion; its effect on throughput is unmeasured. Playback outputs have priority over stems for a free request.
Since October 8 stems upload asynchronously, after job completion. The worker reports job.complete once the restored audio and its playback outputs are published, then uploads the stems (FLAC chunks plus speech and background masters, the original now rendered from the upload) within a 45-minute window and reports them in a separate job.stems message. A stem failure never fails the restore. The table covers one internal API client's 60 s files on the wired mini.
| 60 s file, pro, production, wired mini, 1,627 jobs | Median |
|---|---|
| Download and decode | 0.45 s |
| Inference | 5.2 s |
| Encode | 1.3 s |
| Upload | 0.49 s |
Job (job.complete) |
7.5 s |
Stems published after job.complete |
1.5–2.5 s |
The scheduler routes each restore to the mini where its inference would start first, which ignores the uplink
Open slots alone do not say where a restore will start soonest, because a mini with free slots can still have minutes of pro queued for its one model. Workers also report their inference backlog (the running restore's remaining seconds and the queued restores' expected seconds) in ready and in every ping, and the scheduler sends each restore to the mini where its inference would start first. Starts within 10 s of the soonest count as equal, and worker priority, set per worker by our deploy script, then idle time decide among them. Ties are judged against the soonest start, because equality within a tolerance is not transitive: judged against the running best, estimates of 0, 9 and 18 s all tie in turn and the last wins.
That backlog is the only cost routing sees, and on short files it is the same everywhere. Our two minis reach Cloudflare over different home connections, one at about 50 MB/s upstream with a 3 ms round trip, the other at 6.7 MB/s and 22 ms over Wi-Fi. Once we gave them equal priority on October 14, idle models tied and the longest-idle rule sent every other job of a sequential client to the slower one.
| 60 s file, pro, production | Faster uplink | Slower uplink |
|---|---|---|
| Job, median (p90) | 7.5 s (8.3 s) | 8.3 s (12.7 s) |
Stems published after job.complete, median by hour |
1.5–2.5 s | 5.5–8.2 s |
Inference took 5.2 s on both. The faster mini's figures cover two days, the slower mini's 70 jobs since the priority change. Moving the slower mini from Wi-Fi to Ethernet did not raise its uplink, 4.5 MB/s wired, because its connection is the limit.
In-order callbacks blocked completion behind stale progress, and unretried worker messages re-ran jobs
The scheduler forwards job events to our backend (as job.queued, job.progress, job.completed and so on, the last sent when a worker reports job.complete) through an outbox, a queue in the scheduler's storage that retries each event until it is acknowledged and delivers one job's events in order. Progress within a phase is coalesced, but phase changes and the start and end of each transfer go at once, so even a short restore sent 11 progress events, and its job.completed suffered 0.3–0.7 s of head-of-line blocking behind the undelivered ones. Completion now drops a job's undelivered progress events: its event carries every output they did, and only that job's last intermediate phase and its first-audio time can be lost.
The worker's link to the scheduler had the opposite problem, no retry at all. A message written just before the scheduler dropped a socket was lost, and a worker that reconnected without reporting its completion had the job re-queued and run again: one 95 s job finished after 196 s. Workers now replay their recent terminal job messages after each reconnect, and the scheduler deduplicates them: at-least-once delivery with idempotent handling.
Outside the fleet, transcription and backend calls take longer than the restore
A 4.5 restore is conditioned on the transcript, so for an API client the fleet job sits between a transcription and the calls that record the result. The client creates a project, uploads the file, then requests a generation (one restore of that project); our backend, Cloud Functions on Google Cloud, runs the transcription, queues the fleet job and marks the generation complete. One traced 60 s pro job:
| Stage, one 60 s pro API job | Time |
|---|---|
| Upload, create project | 1.8 s |
| Create generation | 2.0 s |
| Generation created to fleet job queued (transcription) | 4.0 s |
| Fleet job | 7.3 s |
| Fleet job done to client sees complete (2 s polling) | 3.2 s |
Across a day of our internal client's 60 s pro files, transcriptions took 5.0 s at the median and 11.8 s at the p90, so for short files the serial stages around the fleet cost more than the fleet job.
botocore's default 60 s read timeout turned unanswered R2 requests into 62 s stalls
Our backend reaches R2 through boto3: upload checks and probes, the object checks that complete a generation, and transcription artifacts. The client configured retries but no timeouts, so botocore's 60 s default read timeout applied. A request that got no answer waited the full read timeout, then its retry on another connection succeeded, so it ended normally after about 62 s. Cutting the read timeout to 10 s cut the stalls to 11–13 s, which confirms the timeout set their length.
| Over 12 hours before the fix | Took 15 s or more, most about 62 s |
|---|---|
| Upload completions | 22 of 978 |
| Generation completion checks | 26 of about 950, in pairs |
The pairs came from our own design. The SDKs report an upload with complete_project_upload as soon as it lands, and the edge sent its own completion callback at the same moment, so two requests for the same upload, like two completion checks for the same generation, called R2 together and stalled together. The edge's callback now waits 30 s as a backup, by which time the upload is normally recorded and the callback returns at once. Stalls also hit our dev and production backends in the same seconds, although the two share no database, only R2 and the network path to it, which points outside both. A dead pooled connection is the leading explanation; stalls were more frequent after an instance had idled 1–5 minutes (4 of 18 checks, against 11 of 258), though the counts are small. Firestore lock contention is ruled out by the code: the transaction that records an upload makes no R2 call, and the R2 check runs before it.
The stalls became failures where a step had a fixed deadline. The transcription steps that write artifacts get about 60 s, so a stalled write failed the transcription, and because the restore needs the transcript, the generation failed with it: on October 14, all 20 failed generations of our internal client were transcription timeouts.
The client now also sets a 5 s connect_timeout, keeps a longer read timeout only for server-side copies and multipart completion, whose work grows with object size, and ffprobe reading an R2 URL uses a 5 s rw_timeout. We also turned on TCP keepalive, which does nothing here: the kernel's default idle time before the first probe is 2 hours. In the hours since, no transcription has failed. Every retried or slow R2 call is now logged with its error, which separates connect failures from reads that got no answer.
ScoreQ quality scoring runs on a low-priority CPU thread and adds no job time
ScoreQ, a no-reference speech quality model that predicts a mean opinion score (MOS), scores the middle 30 s of each restore's original and restored audio. It runs in onnxruntime on the CPU, from one low-priority thread per worker, off the inference thread and away from the GPU and the Neural Engine. It takes about 2.3 s per job, and runs with scoring on and off showed no difference in job time. job.complete is unchanged; a separate job.quality message follows, sent only to a scheduler whose welcome message lists job.quality among its capabilities, because an older scheduler rejects unknown message types.
A single guidance branch is already compute-bound, so batching across users adds at most 13% throughput
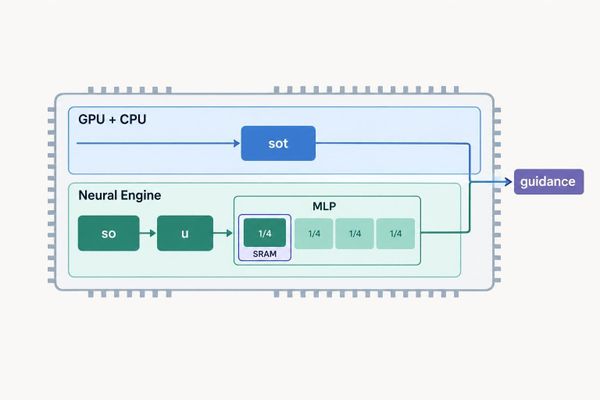
Every 4.5 sampler step evaluates three classifier-free guidance branches; the GPU (through MLX) runs the branches that read the transcript, and the Neural Engine runs the rest, the split the 4.0 port introduced, without its CPU share.
| 4.5 diffusion transformer | Value |
|---|---|
| Blocks, width, SwiGLU MLP width | 16, 1152, 3072 |
| Sequence length per guidance branch (mode token, 50 context latents from the previous window, 375 latent frames) | 426 tokens |
| Compute per branch forward pass | about 272 GFLOP |
| M4 Pro memory bandwidth | 273 GB/s |
One branch's forward pass already runs at 4.6 TFLOPS on the GPU.
| Batch size (guidance branches per GPU forward pass, all reading the transcript) | 1 | 2 | 3 | 4 | 8 | 16 |
|---|---|---|---|---|---|---|
| Time per branch | 59.5 ms | 56.3 ms | 53.9 ms | 53.8 ms | 53.1 ms | 52.9 ms |
A linear fit to the sweep (5.4 ms per pass plus 52.4 ms per branch) bounds the gain from batching at 13%. Reading the weights once per pass takes about 2 ms, so weight reuse, the usual reason to batch, is not what batching would buy here. Peak memory stays under 3 GB at batch size 16; batching across users is blocked by the implementation instead. Branches from different users have different windows and usually different noise levels, while the forward pass shares one window's condition projections, transcript keys and values and context, and one noise level's adaLN modulation, across its batch; and the Neural Engine's fixed-shape Core ML graphs run one branch at a time.
A second copy of the model time-slices the same GPU and costs 8.1 GB
Two copies of the model each restoring a file took twice as long per file as one copy alone, in all three cases we ran: the second copy gets no hardware the first was not using. As a serving design, two worker copies would each overlap I/O with inference the way job slots do, so they would raise throughput only as much as slots do, and a third copy does not fit in memory.
| Restores running at once | 45 s file, flash | 3 min file, flash | 45 s file, pro |
|---|---|---|---|
| 1 | 1.5–1.7 s | 5.4 s | 4.6 s |
| 2 (each) | 3.0–3.3 s | 11.5 s | 8.7–8.9 s |
| 3 (each) | 7–26 s, swapping | ||
| 4 | Metal out-of-memory error |
| Process of one warm model | Footprint |
|---|---|
| Main process: MLX transformer, PyTorch MPS for the first window's speech encoder (Metal memory 5.8 GB) | 6.4 GB |
| CPU process: the next window's first six Granite speech-encoder layers and transcript encoder | 1.2 GB |
| Neural Engine process: Core ML guidance branches and the codec | 0.5 GB |
| Total | 8.1 GB |
4.5 no longer runs part of each MLP on the CPU, which freed the CPU for the speech-encoder work. The 4.0 port reported 10–15x slowdowns with two processes, when its main process alone held 14 GB.
The default open-file limit is 256, so a job must close every file descriptor it opens
A process started by launchd or an SSH session on macOS gets a soft limit of 256 open files (launchctl limit maxfiles prints 256 unlimited). An idle worker holds 37 descriptors, mostly shared-memory IPC segments and pipes to its helper processes, and a running job adds about 25: TCP sockets for its parallel HLS and file uploads, plus ffmpeg pipes and segment files. The default therefore leaves room for about eight jobs.
| File descriptors in the worker process | Count |
|---|---|
| Idle | 37 |
| Peak, six 45 s jobs on a fresh worker | 184 (134 sockets) |
| Peak, six 3 min jobs on a fresh worker | 147 |
| After one burst of six jobs, before the leak fixes | 187 |
| After every burst, with the fixes | 37 |
Two leaks turned that margin into failures. Each job's HTTP client kept its connection pool open after the job ended, and each of its two HLS ffmpeg encoders kept a stderr pipe open in the worker. In the burst after one that left 187 descriptors open, the worker crossed 256: a job failed with OSError: [Errno 24] Too many open files, and uploads failed with nodename nor servname provided, a name-resolution error that disappeared with the leaks. Each job now closes its connection pool, and ffmpeg's errors go to a file instead of a pipe.
The worker also raises its soft limit at startup with setrlimit(RLIMIT_NOFILE), which ffmpeg and the helper processes inherit. macOS rejects an unlimited soft limit, and setrlimit(2) recommends min(OPEN_MAX, hard limit), which is 10240 here. Doing it in code covers the service and the same code started from a shell for smoke tests and benchmarks; a NumberOfFiles entry in a LaunchDaemon's SoftResourceLimits would also set the system-wide kern.maxfiles.
Long jobs and days of uptime, not bursts, grew the worker past 24 GB
The burst peak above is from a fresh worker. In service, one 60-minute restore pushed the worker past physical memory into 8.6 GB of swap, and an idle worker held 11 GB after a day of jobs. Three things held memory that no burst of short jobs exposes:
- The inference thread kept a reference to the last restore it finished, with its full-length arrays, until the next restore replaced it. It now releases the finished job.
- ScoreQ's onnxruntime session kept a CPU memory arena at its high-water mark, 2.5 GB after a few jobs and growing. The arena is now off.
- Each job's full-length audio timelines lived in anonymous memory, which under pressure macOS can only compress or swap. They are now shared memory-mapped files in the job's folder, whose dirty pages the kernel writes back to their own file and drops; they are released when the job unmaps them and deletes the folder. The model's MLX and Metal memory and short-lived arrays stay anonymous.
Outputs are byte-identical. A 60-minute restore has not been re-measured since, and an unidentified allocation still accumulates: after several days of production uptime, one mini held 2.3 GB of swap, and redeploying the worker brought that to 0.5 GB.
The worker sweeps its work and temporary directories at startup, alerts below 20 GB free without refusing jobs, and deploys keep two releases
Each job writes into its own folder under the worker's work directory, removed when the job completes or fails. A crash or power loss mid-job leaves that folder behind, so the worker empties its work directory when it starts, when nothing can be running. Temporary files escaped that rule: one mini's per-user temporary directory held 14 GB of compiled Core ML models (.mlmodelc directories) left by model builds and research runs.
Core ML compiles a model package into a temporary location. Our loader copies each compiled model next to its package, so compiling happens once per machine, and it now deletes the temporary copy as soon as it has its own. The worker also points TMPDIR at a folder inside its work directory, for itself and every process it starts, so the startup sweep covers Python's and ffmpeg's temporary files.
A release's code is 6.6 MB, but the weights bundle (the checkpoints, the speech-encoder and codec models, and the converted Core ML and MLX copies) is 24 GB, so a deploy keeps only the new release and the previous one, the rollback target, and deletes weight bundles neither uses. Seeding a bundle from a folder already on the mini uses APFS copy-on-write clones (cp -c), which share blocks until a file changes.
Below 20 GB free on the work volume (disk_alert_gb in the worker's configuration) the worker reports a warning to our analytics, and below 5 GB an error, repeated while it lasts; a deploy prints the warning and goes ahead. A job that actually runs out of space fails on its own. The worker used to offer no slots below the threshold, which would have taken a mini out of service with 20 GB still free.
/Library/Caches/com.apple.aned, where the Neural Engine service keeps the models it has compiled in a folder per macOS build, stays Operation not permitted over SSH even with full disk access and sudo, so du cannot measure it. On one of ours, a minor macOS update that changed the build took used space from about 408 GB to 50 GB, and the worker's first model load afterwards recompiled its Neural Engine graphs into the new build's folder. That cache grows as the Neural Engine compiles new models, so model experiments stay off fleet minis, and the low-disk warning reports a mini before its disk fills.
A fleet mini runs the worker and nothing else
One of our minis had also served as a desktop and a research machine: it ran the ChatGPT desktop app, started at login by a launch agent, Chrome, a research restore process left from a previous day, and its research checkouts. It had 4.4 GB of swap in use; after the cleanup, 0.5 GB. Any desktop working set competes directly with the model and the running jobs.
The worker checks every minute for processes of its user outside macOS and its own folder, launch agents and daemons other than its own and Tailscale's, and active swapping, and reports any it finds as a warning in our analytics. Swap occupancy was the first signal and proved too coarse, since macOS leaves cold pages in swap long after the pressure that put them there; the worker now warns on the swap-out rate, more than 256 MB written since its previous check. The deploy script refuses a mini that fails the process and launch-item checks, and checks swap only after the old worker has exited, since the old worker's swap is freed with it; if heavy swap remains, it restarts the previous release.
Desktop software comes back on its own: after a reboot, macOS reopened Chrome from the saved login session, and Chrome reinstalled three Google updater launch agents. defaults write com.apple.loginwindow TALLogoutSavesState -bool false stops apps from reopening at login.
Without a logged-in user, macOS 27's audiomxd and configd together use more than a CPU core
On a mini running macOS 27.0 (26A428) with no console user, audiomxd used 70–74% of a core and configd 45%, from boot onward. A sample of audiomxd shows a tight loop: Bluetooth audio routing (-[BTAudioRoutingRequest updateAudioState:withState:]) tries to start an XPC connection to the console user's session, asks configd for the console user (SCDynamicStoreCopyConsoleUser), finds none, and retries. Its log repeats UpdateAudioState failed to start XPC: kUnexpectedErr (No user logged in). Bluetooth was on, with nothing paired.
Bluetooth cannot be turned off headlessly on macOS 27: with ControllerPowerState set to 0 in /Library/Preferences/com.apple.Bluetooth, Bluetooth is still on after restarting bluetoothd or rebooting, and blueutil -p 0 cannot reach the controller without a GUI session, even as root. launchd restarts a killed audiomxd, which loops again within seconds. Auto-login for the service user provides a console user, and both processes drop to 0% CPU. Our other mini, on macOS 26.7, has always logged in automatically and never showed the loop.
On macOS 27, auto-login needs /etc/kcpassword written by hand
sudo sysadminctl -autologin set -userName <user> -password - prints SACSetAutoLoginPassword error:22 even with the correct password, then exits 0. It writes autoLoginUser but not /etc/kcpassword, so the mini still boots to the login window. Auto-login needs both the autoLoginUser key in /Library/Preferences/com.apple.loginwindow and /etc/kcpassword, which holds the password obfuscated with a fixed XOR key. The script below verifies the password with dscl -authonly and writes both. getpass keeps the password out of shell history; it appears in dscl's arguments only while dscl runs.
#!/usr/bin/env python3
"""Turn on auto-login for USER. Run as: sudo python3 set_autologin.py USER"""
import getpass, os, subprocess, sys

KEY = bytes([0x7D, 0x89, 0x52, 0x23, 0xD2, 0xBC, 0xDD, 0xEA, 0xA3, 0xB9, 0x1F])

user = sys.argv[1]
password = getpass.getpass(f"Password for {user}: ")
if subprocess.run(["dscl", ".", "-authonly", user, password]).returncode != 0:
    sys.exit("wrong password")
data = password.encode() + bytes(12 - len(password.encode()) % 12)  # always at least one terminating zero byte
encoded = bytes(b ^ KEY[i % len(KEY)] for i, b in enumerate(data))
fd = os.open("/etc/kcpassword", os.O_WRONLY | os.O_CREAT | os.O_TRUNC, 0o600)
with os.fdopen(fd, "wb") as f:
    f.write(encoded)
os.chown("/etc/kcpassword", 0, 0)
os.chmod("/etc/kcpassword", 0o600)
subprocess.run(["defaults", "write", "/Library/Preferences/com.apple.loginwindow",
                "autoLoginUser", user], check=True)
After a reboot, stat -f %Su /dev/console prints the service user.
Full disk access over SSH and Screen Sharing are turned on in the Mac's System Settings, not from the command line
Full disk access is a macOS privacy permission (TCC, Transparency, Consent and Control, whose database System Integrity Protection guards), which the command line cannot grant, even with sudo, and Screen Sharing turned on from the command line could not capture the screen. Both are set once in System Settings on the mini when it is set up; full disk access can also come from an MDM profile.
| Setting, in System Settings | Why |
|---|---|
General > Sharing > the (i) next to Remote Login > Allow full disk access for remote users on. On macOS versions without that switch: Privacy & Security > Full Disk Access > +, then Cmd-Shift-G and /usr/libexec/sshd-keygen-wrapper |
maintenance runs over SSH, and without it du, ls and the like get Operation not permitted in Desktop, Documents, Downloads, the Trash and other protected folders, even with sudo, so disk use cannot be fully accounted for |
| General > Sharing > Screen Sharing on; under its (i), Allow access for: Only these users, the account the worker runs as; "VNC viewers may control screen with password" off | System Settings, and anything else that needs the desktop, can be reached without going to the mini; clients authenticate with the macOS account |
On a mini reached through Tailscale SSH, the session runs under tailscaled rather than macOS's sshd, so the Remote Login switch, which grants sshd, does not cover it. Granting full disk access to tailscaled itself (for the Homebrew build, /opt/homebrew/opt/tailscale/bin/tailscaled) is the likely equivalent, but we have not yet confirmed that it opens protected folders over Tailscale SSH.
Screen Sharing turned on over SSH (launchctl enable and bootstrap of com.apple.screensharing) opened port 5900, but the client got a black screen, and after the display was woken screensharingd still logged that it could not capture the screen; we turn Screen Sharing on in System Settings instead. While Remote Management is on, the Screen Sharing switch is greyed out as controlled by the Remote Management service. Remote Management grants much broader remote administration, so we turn it off and plain Screen Sharing on.
If a client shows a black screen, the mini's display may be asleep; caffeinate -u -t 5 over SSH wakes it. From Linux, Remmina with its VNC plugin (sudo apt install remmina remmina-plugin-vnc) connects to the mini's Tailscale IP and logs in with the macOS account.
An unattended mini needs host and deploy settings that survive reboots, crashes and failed deploys
| Setting | Why |
|---|---|
The worker is a LaunchDaemon (system domain) with UserName set, not a LaunchAgent |
it starts at boot and needs no login; MLX, Metal, MPS and the Neural Engine all work in that context |
FileVault off, auto-login for the service user, pmset autorestart 1 and sleep 0 |
an unattended mini must boot after a power loss into a logged-in session without anyone typing a password, and never sleep; auto-login requires FileVault off. Anyone with physical access gets an unencrypted disk and a logged-in session |
Spotlight indexing off (sudo mdutil -a -i off) |
every job writes and deletes audio files under the work directory, and indexing them would spend CPU, memory and disk writes the jobs need |
Wi-Fi off on a mini with Ethernet (networksetup -setairportpower en1 off) |
Ethernet and Wi-Fi on the same subnet gave the mini two default routes; the setting persists across reboots |
KeepAlive and ProcessType Interactive in the plist |
launchd restarts a crashed worker and applies no background resource limits; the scheduler re-queues a dead worker's jobs after a 60 s grace period |
PATH in the plist includes /opt/homebrew/bin |
launchd services and non-login SSH sessions do not get Homebrew's path, and ffmpeg lives there |
ExitTimeOut of 3600 s, and SIGTERM drains |
a deploy's launchctl bootout lets running jobs finish instead of killing them mid-upload |
| Each remote deploy command prints its own exit status on a marker line | Tailscale SSH reported exit status 0 for failed remote commands |
| The scheduler stores an expected release per worker | a rolling deploy updates one mini at a time, and the minis not yet updated stay valid and keep taking jobs |
| A smoke restore runs after the release symlink switches and before the service restarts; a failure switches back | a release that cannot load the model or restore a file never takes jobs |
Code ships as a git archive, weights from a bundle on the deploy host |
the minis hold no GitHub or Hugging Face credentials |
| The model loads before the worker offers any slot (11–16 s; on a new machine the Neural Engine's first compile of all 4.5 graphs takes about 5.5 minutes) | a job never waits on a cold model |
Sources
- Diffio Mac mini serving measurements: the dev job timings, burst runs with per-job marks, the GPU batch sweep and its fit, the model-concurrency runs, per-process memory, file-descriptor counts before and after the leak fixes, inference times per file and the host figures behind the tables. The stem upload benchmark, the ScoreQ timing and the macOS 27
audiomxdsample come from separate runs on the same minis and are not in this file; thresholds and deploy settings come from our worker's code and configuration. - Diffio production telemetry, October 13–14, 2026 (not published): per-stage fleet job timings from our edge scheduler's job events (the 60 s pro split, the wired and Wi-Fi mini comparison), separated-track timing from the workers' logs, the traced API job and transcription times from backend events, and the R2 stall counts from Cloud Run request logs, in the routing, callback, API-path and R2 sections; the uplink figures are 25 MB uploads to Cloudflare's speed test endpoint from each mini. Queue, routing, upload-limit, memory and timeout settings come from our worker, edge and backend code.
- Diffio fleet operations, October 21–22, 2026 (not published): one mini's used space before and after a macOS update changed the build, which folders stayed unreadable over SSH with and without full disk access, which process serves an SSH session on each mini, and Screen Sharing enabled over SSH, in the disk and the full disk access and Screen Sharing sections.
- botocore Config reference:
connect_timeoutandread_timeoutdefault to 60 seconds, andtcp_keepaliveonly sets the socket option, in the R2 section. - FFmpeg protocols documentation: the
rw_timeoutprotocol option, in the R2 section. - setrlimit(2), Apple man page: the rejection of an unlimited
RLIMIT_NOFILEsoft limit and themin(OPEN_MAX, rlim_max)recommendation, in the open-file section. - launchd.plist(5):
UserName,KeepAlive,ProcessType,ExitTimeOut,EnvironmentVariables, andSoftResourceLimitssettingkern.maxfilesfor a daemon, in the open-file section and the settings table. - Core ML: Downloading and compiling a model on the user's device: compiled models land in a temporary location and should be moved to a permanent one, in the startup-sweep section.
- How to log in automatically to a Mac user account, Apple Support: FileVault disables automatic login, in the settings table.
Related Diffio posts
- Partitioning MLPs Along the Intermediate Dimension Let the Apple Neural Engine Run Two of Three Guidance Branches: how one restore divides its guidance branches between the GPU, the CPU and the Neural Engine.
- Classifier-Free Guidance: The Guidance Scale Is an Exponent on an Implicit Classifier: why each sampler step evaluates several guidance branches.